Constellation Height-Inclination Distributions
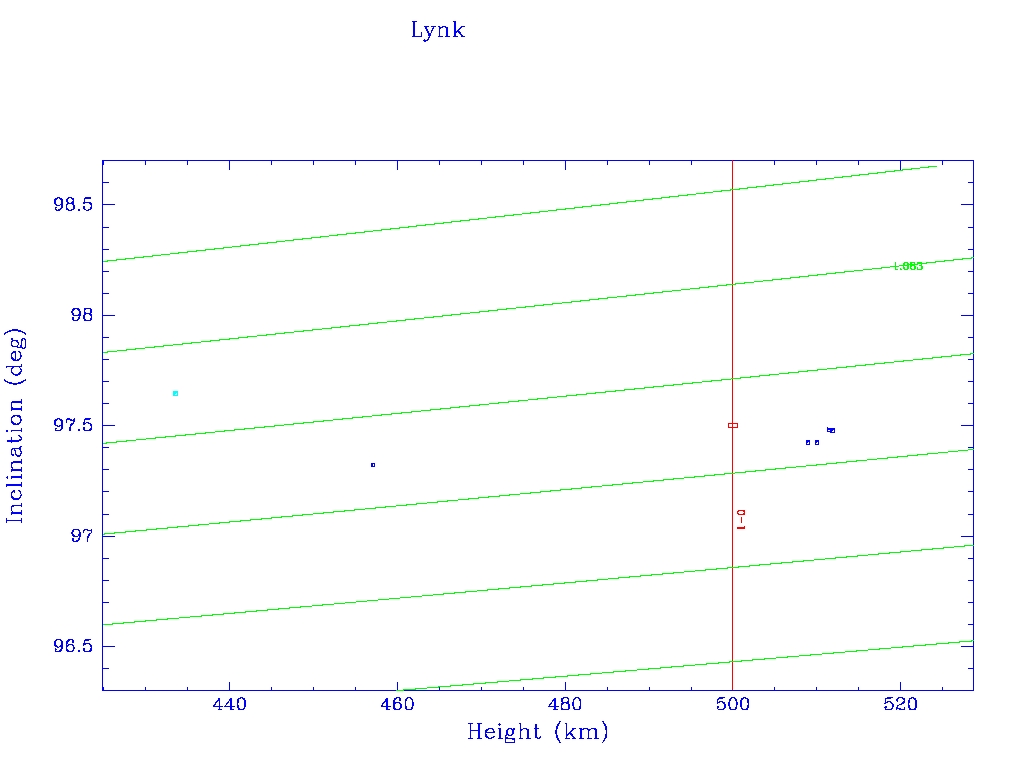
These plots show the various shells of the constellations.
- Current satellite orbital height and inclination are shown as blue dots.
- Vertical red lines show the nominal heights of the constellation layers as declared by the constellation owner; red squares on those lines show the nominal position of the shell in height and inclination.
- Vertical magenta lines show actual heights of operational subshells as identified by me.
- Slanted green lines show loci of constant orbital plane precession rate (figures are in degrees per day). This shows, for example, that Starlinks group 1 and 4, although at different height and inclination, have orbital planes which precess at the same rate.
